News Article
QIMA Q4 2026 Barometer: China’s Rebound Shows How Fast Reactive Diversification Can Unwind
Oct 20, 2026
TL;DR
US sourcing continued shifting back toward China through Q3. Much of 2025's tariff-driven move away from China was reactive and fast; Q3 data suggests it is unwinding at a similar pace. Even so, the move remains limited, and still a long way from a reversal of diversification. QIMA's Q4 barometer, informed by product inspection and supplier audit data, examines which supply chain moves have staying power.
Key Takeaways
China's rebound is real but partial: China's share of North American volumes hit 40% in September, the highest monthly level since October 2024, yet China inspections in Q3 are only 15% above 2024 levels.
Capacity-seeking alone no longer explains the shift: Southeast Asia's shortages eased, yet North American demand for China kept rising – a sign that tariff-led diversification reverses quickly once the tariff gap narrows enough for China’s underlying strengths to compete again.
Nearshoring and reshoring remain limited: Shares held at 6% in North America and 12% in the EU, while the EU mix tilted toward Mediterranean markets such as Egypt, Morocco, and Tunisia.
South and Latin American buyers step up supply chain diversification: China's share in the region’s inspections slid from 81% to 79% in Q3, while demand for Southeast Asia more than doubled.
Listen to our Supply Chain Soundbites podcast for a 5-minute breakdown on China's rebound and Q4 sourcing outlook
QIMA Supply Chain Snapshot
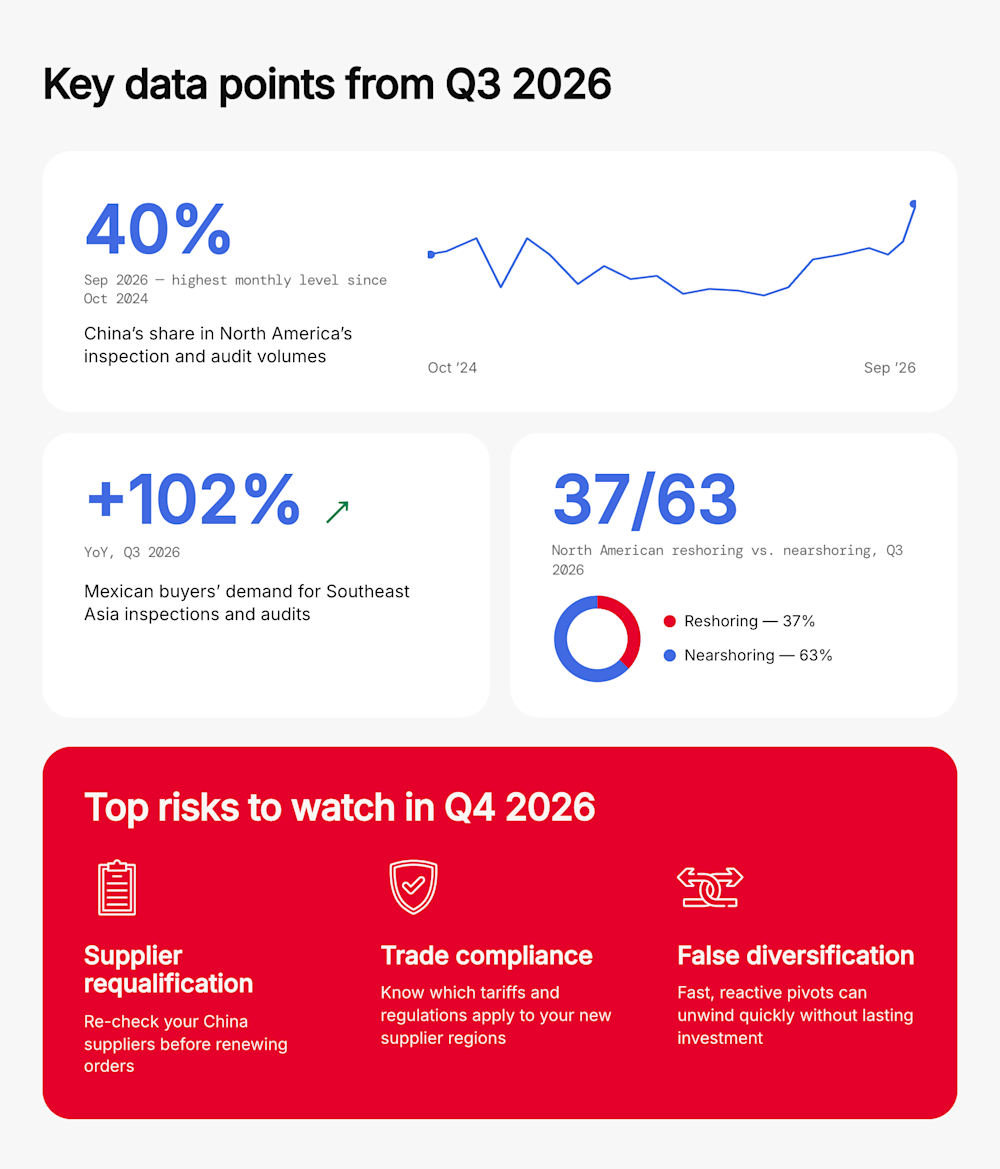
Key data points from Q3 2026
40% (Sep, highest monthly level since Oct 2024): China's share in North America's inspection and audit volumes in September
+102% YoY: Mexican buyers' demand for Southeast Asia inspections and audits in Q3
37/63: Reshoring vs. nearshoring split in North America’s home-region sourcing
Top risks to watch in Q4 2026
Supplier requalification risk: Buyers returning to China should recheck audits, capacity, and compliance before renewing orders.
Trade-compliance risk: Shifting supplier regions doesn’t automatically remove exposure to tariffs or compliance scrutiny.
False-diversification risk: Fast, reactive pivots can unwind quickly without lasting investment behind them
A Narrowing Tariff Gap Pulls US Buyers Back Toward China
In Q2, as the Hormuz fuel crisis took hold, Western buyers started diverting orders from Southeast Asia to China, pushing China’s share of North American service volumes with QIMA to a six-quarter high. Speaking to the New York Times, our CEO, Sébastien Breteau, cited fuel shortages across Southeast Asia as a likely driver of the move. Given the region’s strained factory capacity at the time, our previous barometer read this as primarily capacity-driven.
With fuel shortages in Southeast Asia starting to ease in Q3, EU buyers' sourcing mix stabilized, but US buyers kept diverting orders from the region. As a result, China’s share of North American service volumes rose in five of six months from April to September, reaching 40% in September, its highest monthly level since October 2024.
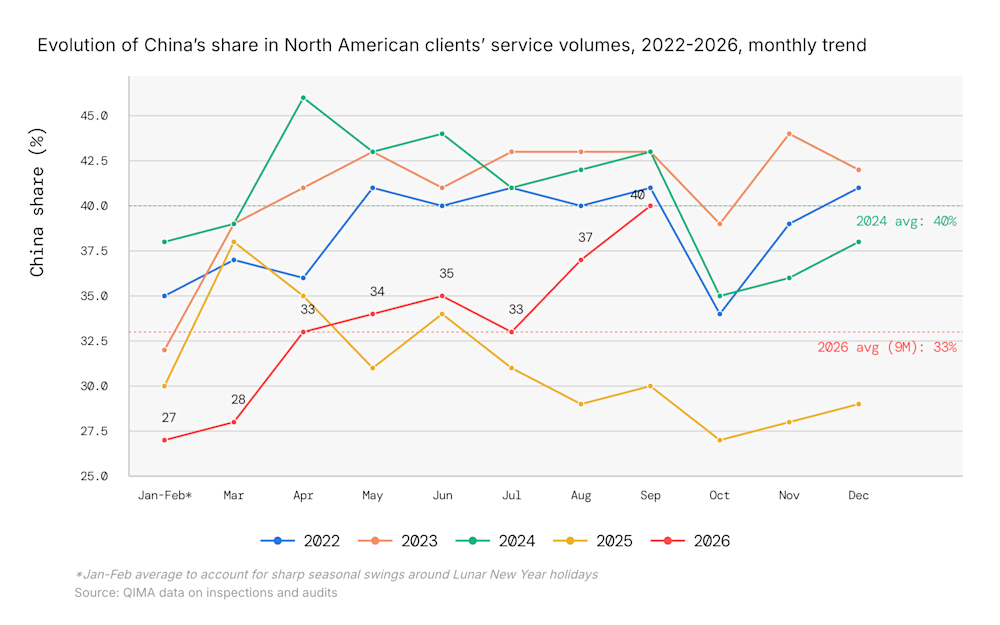
Figure 1: China’s share hit 40% in September 2026, its highest monthly level since October 2024 – even as the fuel shortages that originally drove the shift began to ease.
Allowing for the lag between orders and inspections, QIMA’s September figures likely reflect buyer decisions made in July and August, when Southeast Asia's factory capacity was already recovering – meaning buyers chose China even as the original driver of the shift was fading. The bigger reason looks to be the narrowing tariff gap between China and Southeast Asian manufacturing hubs, tightened further by new Section 301 forced-labor tariffs on Cambodia, Indonesia, Malaysia, the Philippines, Singapore, Thailand, and Vietnam. QIMA clients and press reports note that as the gap shrinks, China's mature manufacturing infrastructure, skilled labor base, and reliable energy supply do more to offset the remaining tariff costs, making China cost-competitive even at a tariff disadvantage.
Current Rebound: Fast, but Limited
It's important to note that this move back toward China is still limited in scale: at its current pace, China’s share in North American service volumes is set to finish above 2025 levels, but well below the 2024 average. In 2025, after the US tariff escalation, China’s share fell at the fastest pace in six years, with nearly all the displaced share moving to Southeast Asia – and the current rebound rolls back part of that rapid drop, not the broader diversification trend of the past decade. Demand tells the same story: China inspections rose +51% YoY in Q3 2026, but that mostly reflects 2025's low base. Compared to 2024, the Q3 growth slows to +15%, and 9M 2026 is flat versus 9M 2024.
Scale aside, the pace of the rebound is itself telling: a shift driven by a sudden tariff escalation unwinds just as reactively once relative tariff pressures change. This shows how fragile reactive, disruption-driven diversification can be, especially when it moves faster than a region’s manufacturing can mature. Buyers returning to suppliers they once left or scaled back should recheck audit status, capacity, compliance, and traceability before placing new orders.
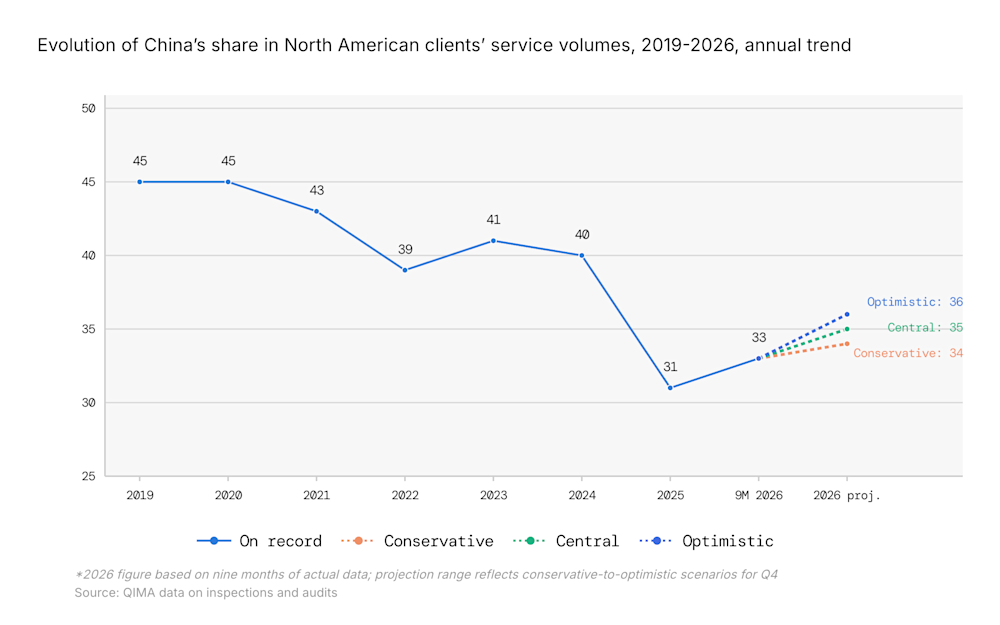
Figure 2: At current pace, China’s 2026 share is projected to land between 34–36%, above 2025’s 31% but still well below the 2019–2024 average.
Nearshoring Momentum Remains Limited for North America and the EU
QIMA’s inspection and audit data shows limited progress on nearshoring and reshoring during Q3, despite both acknowledged as crucial for supply chain diversification and de-risking.
For North American buyers, nearshoring and reshoring together accounted for 6% of service volumes in Q3, unchanged from the first half of 2026. The mix within that total has shifted over the longer term, though: reshoring now represents 37% of North American home-region sourcing, roughly double its share in 2022. Growth in absolute terms, however, remains slow, and policy uncertainty is adding to the challenge, particularly for US domestic sourcing: in a recent Reshoring Initiative survey, 57% of US respondents cited it as a dominant concern, far above any other single factor.
In the EU, the combined share of reshoring and nearshoring in buyers’ service volumes also remained broadly stable, at 12% in Q3. Within that stable total, however, the mix shifted toward the Mediterranean, with Western European reshoring and Eastern European nearshoring losing share. Inspection demand in Mediterranean markets outside Turkey grew 10% YoY in Q3, outpacing overall growth in EU buyers’ inspection demand. The gains were concentrated in Egypt (+11% YoY), Morocco (+12%), and Tunisia (+20%), which together accounted for more than half of all nearshoring activity among EU buyers. All three continue to position as lower-cost, textile-manufacturing alternatives to Turkey, backed by sustained foreign investment.
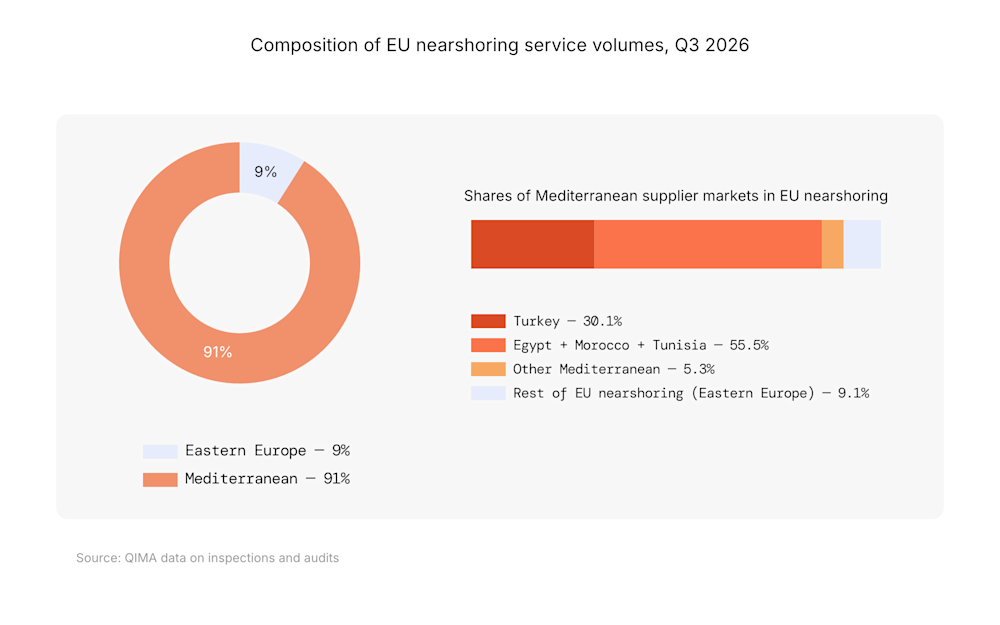
Figure 3: Egypt, Morocco, and Tunisia together made up over half of EU nearshoring activity in Q3 2026, outpacing Turkey as Mediterranean sourcing continues to gain share from Eastern Europe.
South and Latin America’s Diversification Boosts Southeast Asia’s Growth
In contrast to North America’s partial rebound towards China, South and Latin American buyers took steps to reduce China concentration in Q3 by shifting some volumes to Southeast Asia.
While China still dominates South and Latin American sourcing (79% of the region's service volumes with QIMA in Q3 2026), it has been steadily ceding ground to Southeast Asia, whose share has doubled since Q3 2024. Mexico led the increase: demand for Southeast Asia inspections and audits from Mexican buyers rose 102% YoY in Q3, with Vietnam a key supplier market (+99% YoY).
The shift helps buyers reduce single-country concentration risk, and gives Southeast Asian suppliers a source of demand beyond Western markets. This was particularly relevant in Q3 2026, when demand from North American buyers was down -3% YoY, while EU demand only grew a modest +4% YoY. By contrast, demand from South and Latin American buyers for Southeast Asia inspections and audits more than doubled year on year.
South and Latin America is now Southeast Asia’s third-largest buyer region in QIMA’s data, accounting for 14% of the region’s service volumes, up from 7.5% a year earlier. While still smaller than North America and EU in absolute terms, its rapid growth is making South and Latin America an increasingly important source of Southeast Asia’s manufacturing demand.
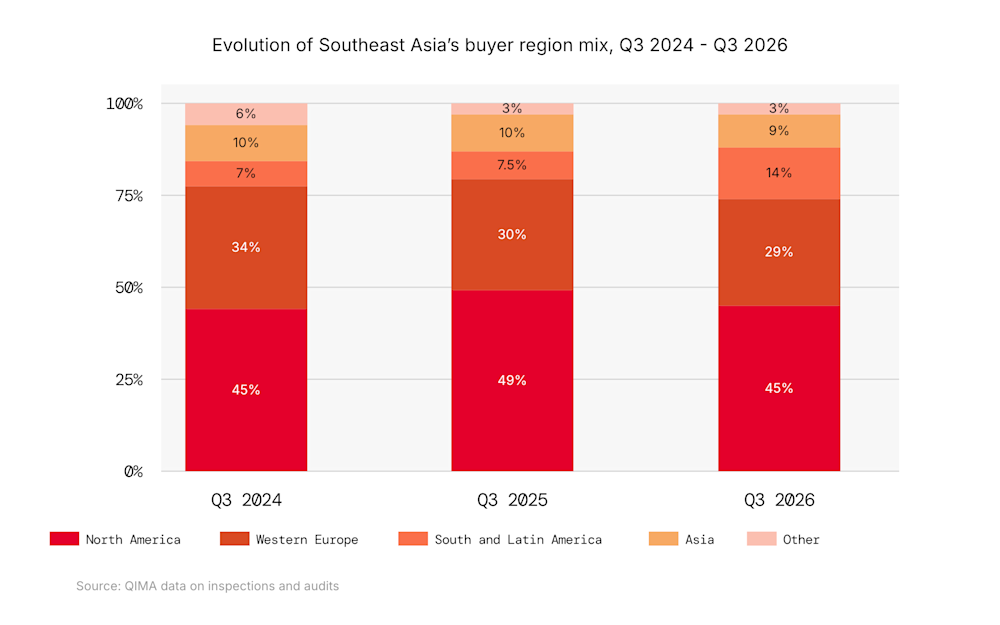
Figure 4: South and Latin America’s share of Southeast Asia’s service volumes nearly doubled between Q3 2024 and Q3 2026, overtaking Asia itself to become the region’s third-largest buyer market.
Q4 Outlook: The Case for More Strategic, Less Reactive Diversification
Last quarter asked whether the Hormuz fuel crisis would accelerate nearshoring. It hasn't yet: nearshoring and reshoring shares held steady in Q3, even as North American buyers moved back toward China and part of 2025's tariff-driven shift reversed.
Unlike reactive supply chain pivots, durable diversification is gradual, spread across risks that don’t move together, and built on long-term fundamentals rather than short-term cost swings. Q4 will show whether this quarter’s moves are early signs of that kind of shift, or just more reactive course-correcting.
Share this on


