

Know where your product stands on skin longevity.
Longevity SCORE is the first standardized biomarker test for skin longevity activation. One number, 0 to 100, from measured protein carbonylation on an organotypic platform.
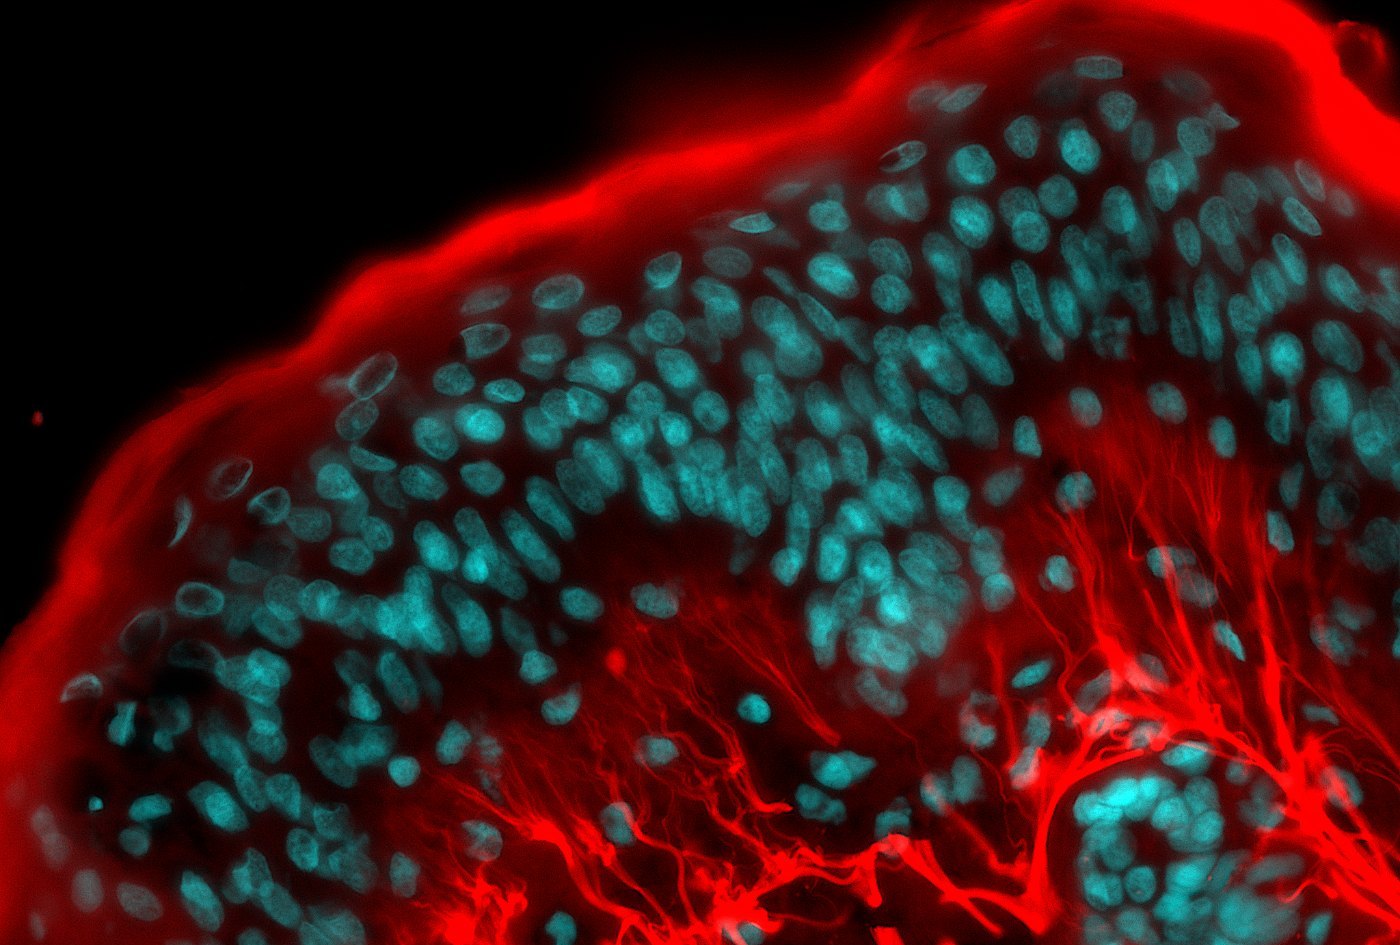
Find out where your product stands.
- Validated SCORE (0–100) + tier classification
- One-page PDF assessment report
- Full-resolution fluorescence image stacks
- Statistical summary + 95% confidence interval
- Claim-ready language for marketing & regulatory
- Delivery via myQIMA client portal
Check your product compatibility
A 30-second technical check to confirm SCORE fits your test article, before you pay a cent.
SCORE is an ex vivo human skin assay. Topicals, raw actives and nutraceuticals are all in scope; injectable or device products need a different test, so we'll route you to the right one.
Let's find the right test
SCORE is built for topical articles applied to ex vivo human skin, so it isn't the right fit for this product. Our scientists can point you to the right assay, often within the same longevity panel, usually within one business day.
A QIMA specialist will recommend the right assay and timeline. No charge, no obligation.
You will be forwarded to a payment page on stripe.com.
By ordering, you agree to the Commercial Terms of Service.
Self-order, no sales call required.
-
1
Check compatibility
A 30-second technical check confirms SCORE fits your test article, before you pay a cent.
-
2
Order and pay online
Fill in a short form (compound name, sample details) and pay securely at checkout. Confirmation and shipping instructions within 24 hours.
-
3
Ship your sample
Send your sample to whichever intake lab is closer, US (Boston) or Europe (Créteil, France), using the provided specs. Headache-free logistics.
-
4
Receive your report within 4 weeks of sample acceptance
Score, benchmark, images and claim wording arrive together in your myQIMA portal.

The most direct measure of skin longevity activation available today.
Protein carbonylation is one of the key hallmarks of skin aging. We measure how much of it your product prevents under UV stress. The method sits behind 30+ peer-reviewed publications.
- 01 UV stress Photoaging model
- 02 Ex vivo skin Aged skin, surgical donors
- 03 Treatment · n=3 Your test article, applied topically
- 04 Fluorescence Carbonylation imaging
- 05 Image analysis 6 image sets quantified
- → Score 0–100 Tier A/B/C, benchmarked
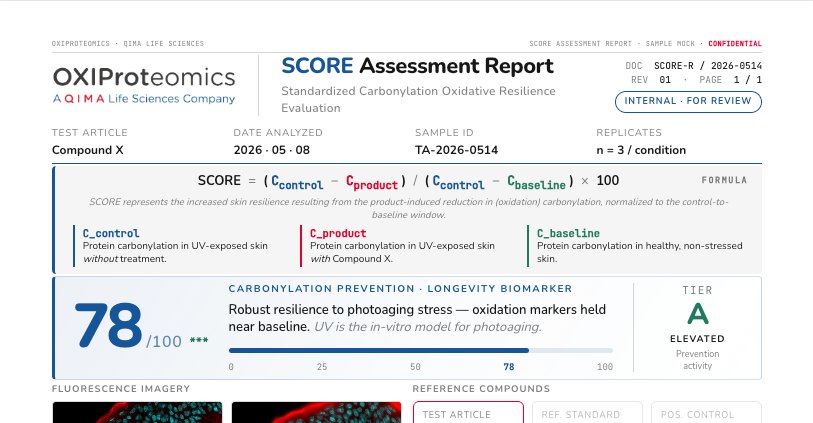
One page: a single validated score benchmarked against reference actives and the confidence interval behind it.
- 1 page PDF · Tier classification · Statistical summary
- Fluorescence image set · Claim-ready language for marketing & regulatory dossier
The full PDF arrives in your inbox.
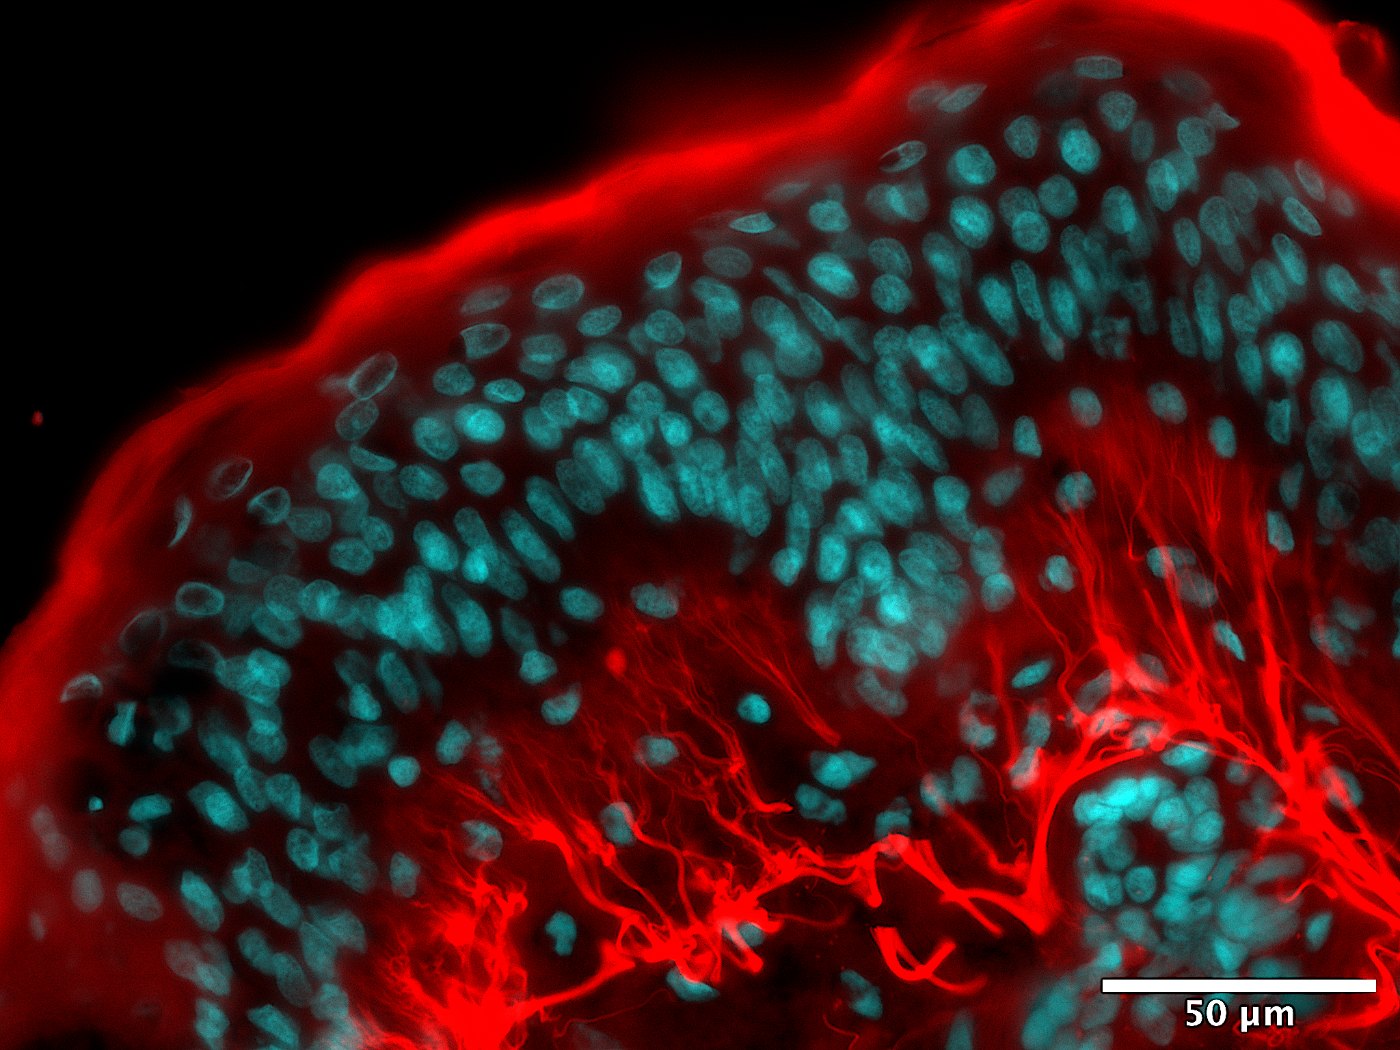 Before · control
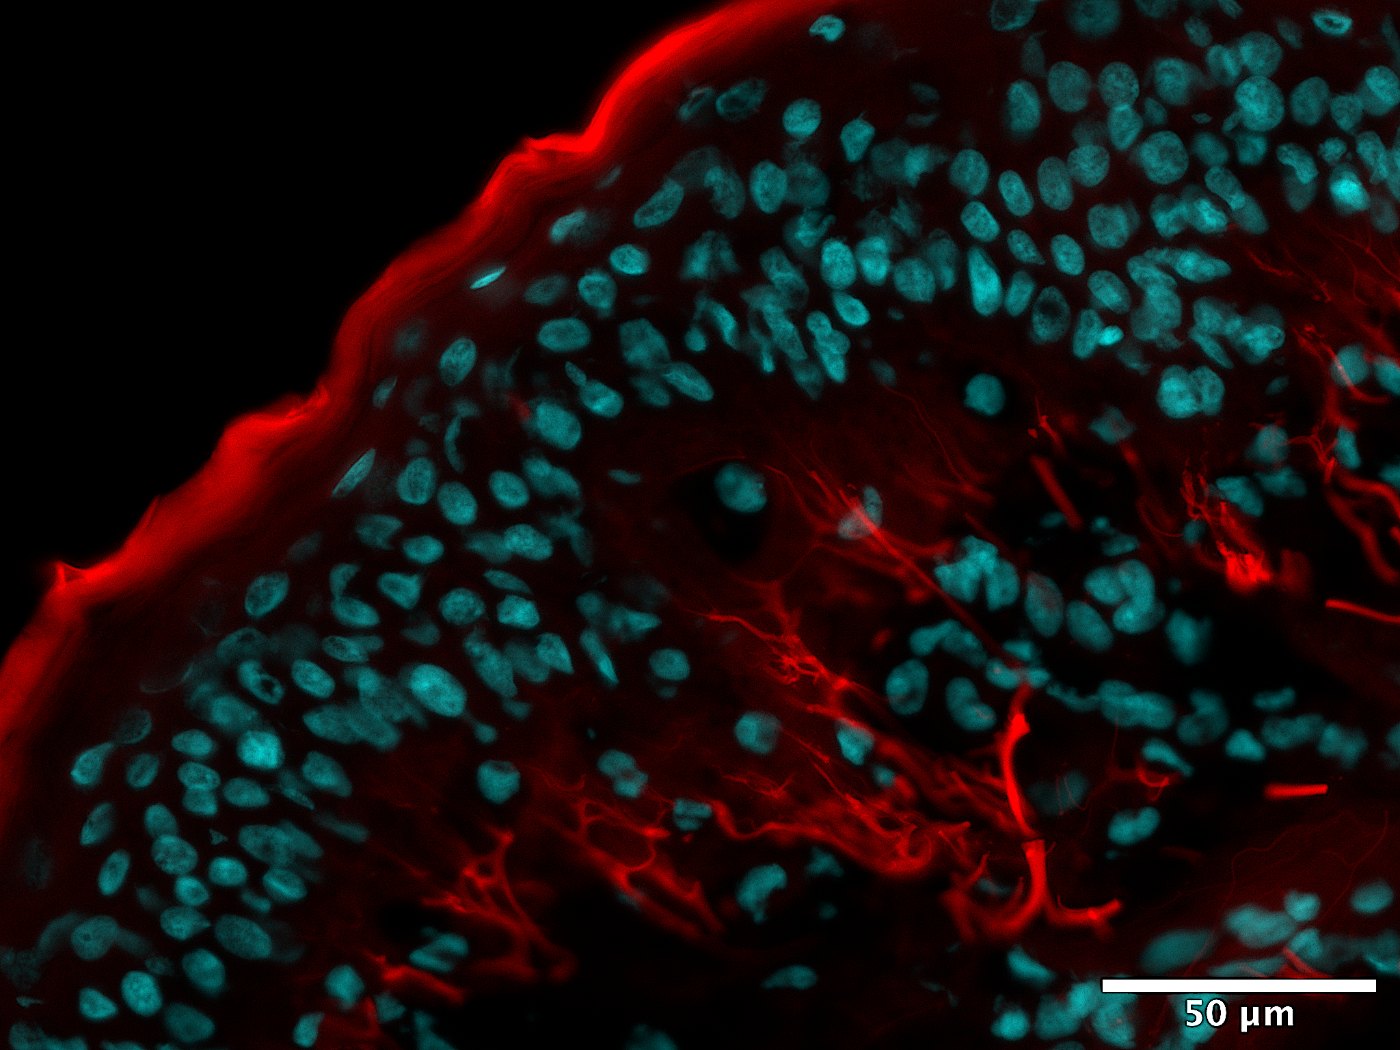 After treatment
Red marks protein carbonylation across the stratum corneum, epidermis and dermis: less red, higher score.
C is protein carbonylation, normalized to the control-to-baseline window. Mean ± SD across 3 replicates, p < 0.001 vs. control (one-way ANOVA, Dunnett's, 95% CI).
Every value is a percent reduction in protein carbonylation, normalized to the stressed control (= 100%) and reported as mean ± SD (n = 3 per condition, 6 measurements total). *** denotes p < 0.001 vs. control by one-way ANOVA with Dunnett's post-hoc (95% CI). Reference actives are drawn from published literature; where a compound spans a reported range, the striped band shows it. The same chart appears on your assessment report, so a claim made here is the claim you can defend.
SCORE is just the beginning.
A SCORE tells you where your test article stands. Our longevity packages go further: multi-compartment imaging, multi-biomarker panels, full claim-substantiation dossiers. Start with a SCORE; build the science from there.
See the longevity packages Hide the longevity packages
SCORE in two compartments, with biomarker-backed claims.
- 2 compartments: dermis + epidermis
- +2 biomarkers / claims
- 8 weeks · n=3
- PPT report + image stacks
SCORE across all three skin compartments, fully substantiated.
- SCORE across 3 compartments
- +3 biomarkers / claims
- Incl. stratum corneum
- 8 weeks · n=3
Donor-spanning study, à la carte biomarkers, publication-ready.
- +6 biomarkers / claims, à la carte
- 3 compartments · 3 donors (n=3)
- Publication-ready data package
Fully bespoke, scoped end to end with our scientists.
- 3 hallmarks × 3 biomarkers
- Phase 1: discovery, wks 1–6
- Phase 2: spatial proteomics
- Publication-ready, IP-protected
* Longevity packages are discounted when you order within 30 days of your SCORE report.
Frequently Asked Questions
How do I ship my samples?
5 g or 5 mL at room temperature, shipped on our prepaid label. Cold chain, frozen or controlled-atmosphere shipping can be accommodated and may incur additional fees. Samples are used up in testing and are not returned, so send only material you do not need back, in the quantity noted in your shipping instructions.
What if my product is not a fit?
Contact an expert to discuss at score@qima.com.
Could anyone find out what's in my test article?
You send us a test article to understand how it affects human skin, not to expose what's in it. So everything we hold sits in one of two strictly separate layers: the anonymous measurements we keep by default, and anything that could identify you or your formula, which we only ever use if you opt in in writing. The next two answers spell out exactly what falls in each. You keep ownership of your test article and your named result, always.
What do you keep by default, without asking me?
Stripped of any identity, the measurements feed and sharpen the SCORE reference scale. This is what makes every future benchmark more precise, for you and the field.
- The 0–100 score and underlying carbonylation values
- Replicate count, confidence interval, method data
- Coarse class only (e.g. "topical, polyphenolic antioxidant")
- —Never your name, brand, or test article
What can you never share unless I say yes?
Your test article, your brand, your named result. Used as a public benchmark or case study only when you opt in, in writing, for a specific purpose.
- ›Your test article and its full composition
- ›Your named, attributed SCORE
- ›Case studies and co-marketing
Where is my data kept, and who can see it?
Identity and test-article details sit in an encrypted store, joined to the results database only by an internal key a handful of people can touch. We never publish a category statistic below a minimum membership (n ≥ 8), so no single compound can be reverse-identified by triangulation, and identifiable use is always a separate, optional consent.
Read the full terms & conditions.